
Reserve Bank of India’s Order Books, Inventories and Capacity Utilisation Survey (OBICUS) released last week indicated a strengthening of an increase in capacity utilisation seen since early 2018. In the quarter ended September 2018, capacity utilisation was 74.8 percent. The average capacity utilisation of industries during the four quarters ended September 2018 works out to 74.5 percent. This is much better than the earlier observations that indicated a trend of falling capacity utilisation tending towards an average of 72 percent.
This reversal and uptick in capacity utilisation raised some cautious hopes of a revival.
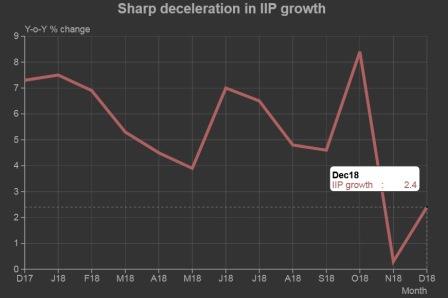
However, industrial production data releases post September 2018 indicate that the momentum seen in capacity utilisation could have dissipated quickly.
The year-on-year growth in the Index of Industrial Production (IIP) in November and December 2018 were low at 0.3 percent and 2.4 per cent, respectively, compared to the average growth of 5.7 percent in the preceding seven months of 2018-19. Growth rates have tapered in all the three segments of the IIP – mining, manufacturing and electricity.
In the classification of industries by usage, primary goods has reported a year-on-year fall of 1.2 percent in December 2018. Primary goods is the largest segment of the IIP with a share of 34.1 percent in the IIP. Its poor performance in December reflects a significant YoY fall in production of petroleum products and fertilisers. Diesel, which has the highest weight among petroleum products, saw an 8.5 percent fall in production in December. November had clocked positive growth rate. Petrol production was down 1.1 percent in November and 10.3 percent in December. LPG was down 5.3 percent and 6.4 percent, in November and December 2018, respectively.
Similarly, production of fertilisers declined in November and December. Electricity generation grew 5.1 percent in November and 4.5 percent in December. This is much lower than the average growth of 8-11 percent in the preceding three months.
Year-on-year growth in the consumer goods index was accelerating till October 2018. Its growth rate ramped up from less than 2 percent in May 2018 to 12.8 percent in October 2018. Then, it tanked to 1.2 percent in November and reported a weak 4.4 percent in December. In November, the fall cut across consumer durables and non-durables.
Much of the fall in the consumer durables index can be explained by the fall in production of automobiles. Production of cars for example, declined year-on-year by 22 percent in November and 11 percent in December. Two-wheeler production was up by a measly 2.5 percent during the two months. The sluggish growth in automobiles has also had an impact on production of automobile components that are also a part of the consumer durables index. Growth dropped to a mere 1.5 percent in November compared to double-digit growth in the preceding 12 months.
The fall in production of automobiles, automobile components and petroleum products, which is interestingly synchronised, is largely responsible for the slowing down of the IIP in November and December 2018.
This fall seems to be continuing into January 2019. Production of passenger cars, two-wheelers and three-wheelers during the month was lower compared to a year ago. Sales too were lower for these (except three-wheelers) and also in the case of commercial vehicles and multi-utility vehicles.
Further, electricity generation other than renewable was 1.5 percent lower during January 2019. The YoY fall was the first since April 2015.
Only two major industries show robust growth rates. These are, steel and cement. Steel has been far less impressive than cement. Yet, it dazzled with a 13.2 percent growth in production in December after having clocked only low single digit growth rates for a year. Cement production has been growing at a healthy clip. Its growth averaged 13.9 percent during April-December 2018.
This sustained high growth in cement production and also the relatively healthy growth in steel production possibly, is the outcome of the healthy pace at which roads are being built. While monthly, or even quarterly data on roads construction is not available systematically, according to a Press Information Bureau release, 5,759 kilometer of highways were constructed between April and November 2018 compared to 4,942 kilometer during the same months of 2017. This implies an impressive 16.5 percent increase in production.
While the sustained growth in roads seen till late 2018 is impressive, it is possible that even this could be slowing down. New orders have slowed down since November 2018. Overall new orders inflows have slowed down from an average of Rs.477 billion per month during April-October 2018 to Rs.204 billion per month during November 2018 – January 2019. Orders for industrial and infrastructural construction have dropped from Rs.224 billion to Rs.102 billion in a similar period comparison.
The year-on-year declines in electricity and automobiles and the fall in order book positions in January suggest that the decline in industrial output seen in November and December 2018 is likely to continue.


