
By Mahesh Vyas
India’s gross domestic production grew by 8.2 per cent in real terms during the first quarter of 2018-19 compared to its level in the first quarter of 2017-18. This is the fastest growth in 9 quarters, i.e. since the quarter ended March 2016.
All the major components of demand posted healthy y-o-y growth rates in the first quarter. Private final consumption expenditure grew by 8.6 per cent, gross fixed capital formation grew by 10 per cent and exports grew by 12.7 per cent. Government final consumption expenditure grew at a lower rate of 7.6 per cent indicating that the growth in the first quarter was not driven by the government pumping up growth through its spending but, by households consuming more, enterprises investing more and the country exporting more.
GDP estimates, which are the estimates of demand components of the economy, are made largely using indicators from the supply side. Production estimates used in the estimation of Gross Value Added (GVA) in agriculture, industry and services are the main inputs to compute the GDP.
Thus, estimates of agricultural production during the first quarter play a dominant role in the estimation of consumption of food items in the estimation of private final consumption expenditure. Food accounts for a substantial 30 per cent of the Private Final Consumption Expenditure (PFCE). As we have seen in estimates of agricultural production are inexplicably high compared to the rabi crop sowing data released by the ministry earlier.
If the agricultural production data are overestimates because of this, as it seems likely, then the food consumption component of the PFCE will also be an overestimate.
A key indicator in estimating consumption of manufactured goods in the PFCE is the Index of Industrial Production (IIP) production data. Similarly, for the consumption of services, the indicator used is the output of services as estimated for compiling gross value added of services. These are likely to skew the consumption estimates in favour of the consumption of goods and services produced in the organised sectors.
But, this has always been the case and so it does not impact the relative performance of the current quarter compared to earlier quarters.
Gross fixed capital formation grew by 10 per cent, y-o-y, in real terms. This is impressive in itself and more so because this was the third consecutive quarter of a robust growth in Gross Fixed Capital Formation (GFCF).
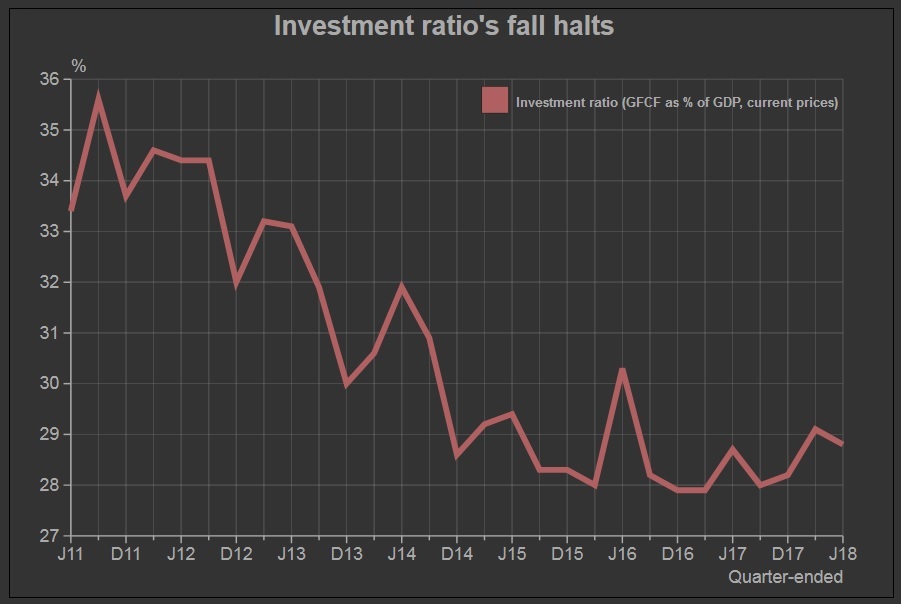
The investment ratio (based on nominal values as is usually done) works out to 28.76 per cent. The ratio has been falling steadily. It was 35.61 per cent in the quarter ended September 2011. It reached its lowest level of 27.95 per cent in September 2017. After rising for two quarters, ended December 2017 and March 2018, it fell again a bit in the June 2018 quarter.
The falling investment ratio is perhaps, the most worrying aspect of India’s growth trajectory. It raises doubts on whether the current growth rates can be sustained.
So, there is a pick-up in investments as indicated by the impressive growth rates in the GFCF and the not-falling-anymore investment ratio of the past three quarters. Official quarterly estimates of GFCF are based on the performance of the construction sector and production of machineries.
The construction sector has seen a spurt in its growth. After languishing mostly under 5 per cent, growth accelerated to 6.6 per cent in the December 2017 quarter, then it shot up to 11.5 per cent in the March 2018 quarter and it clocked a robust 8.7 per cent in the June 2018 quarter. IIP data shows machinery indices recording respectable growth rates. In the first quarter of 2018-19, production of computers and electronics grew 34.5 per cent, that of electrical machinery grew by 6.8 per cent and other machineries grew by 5.2 per cent. Each of these was significantly better than the performance in the corresponding quarter a year ago.
RBI’s Order Books, Inventories and Capacity Utilization Survey (OBICUS) indicates a capacity utilisation of 75.2 per cent in the quarter ended March 2018. This is the best utilisation ratio in four years. Plant load factor of thermal power plants has improved marginally from 59.6 per cent during April-July 2017 to 61.6 per cent in April-July 2018. Aggregate new orders have been rising. Average aggregate new orders in the June 2018 quarter were more than twice the level in June 2017. They were more than twice similarly in the preceding two quarters.
These are encouraging signs and they resonate with the official estimates of a pick-up in construction and capital formation.
CMIE’s CapEx database does not show any pick-up in new investment proposals. This implies that the pick-up in construction, production of machineries and order books are a reflection of an increase in implementation of existing capex plans. The small increase in capacity utilisation indicates that slack capacities are being harnessed.
This coincident uptick of multiple indicators suggest a very early phase of a turnaround in the investment cycle. This trend needs to consolidate and gain momentum before new investment proposals start rising or before companies start once again reporting robust increases in their net fixed assets. We will keep a close watch on both.


