
You have arranged capital. You have zeroed in on a stock. Reasonable research has been done; fundamentally, technically et al. You are all set to throw your money in, and you are convinced that this one investment is going to be a multi bagger. But, yet, you are itching for a confidence booster; something that would nod in agreement with your conviction, something that would scratch away those nagging suspicions. In reality, there is no such “something”; so you end up picking up information selectively that tells you what you want to hear. In psychological parlance, this is called “confirmation bias”. Avoiding confirmation bias is one of the biggest challenges of a stock trader.
For an investor looking to park money for the longer term, a certain amount of guesswork goes with the nature of the investment. You cannot make an investment call that lasts, say, five to ten years, without taking a leap of faith, because the contributing factors like interest rates, regulations, company’s management, investment climate, competition etc., are so numerous and complicated that every single one of them are guaranteed to see changes. So confirmation bias serves to soothe your nerves at the time of investment, without ending up too much costly, as you get to correct your mistakes since you have time on your side. But with futures and options, every trade is defined by the number of days to expire, which in turn makes it a ticking time bomb. In other words, with an F&O trade or a short term stock trade, you would need to do solid ground work and make your moves with utmost skill and discipline, whereas you could always take a speculative approach for the long term. Not what you usually hear about investors and speculators, is it?
Let us put some open interest analysis into this and see if it serves to ease the decision making problem. Like most analyses, Open Interest (OI) also serves to give insights on the future based on the present or historical data. Where it scores over other analyses is the nature of the data which is already a view on the future. So, how does OI help?
OI in layman’s language
When you buy a stock future, you are theoretically expressing your interest to take possession by the expiry of the futures contract, while on the other hand, the seller of that stock future is expressing his interest to sell the same by expiry. In other words, though there are two parties to this trade, the expression of interest is on one contract. So, when you see that an OI of a stock is 1000, then it means that traders have shown interest in 1000 contracts. So a rise in OI automatically means a rise in interest in that stock. This information becomes more meaningful, when we illuminate the study of OI with price moves and see what comes forth when both are read together. This is how it would look like:
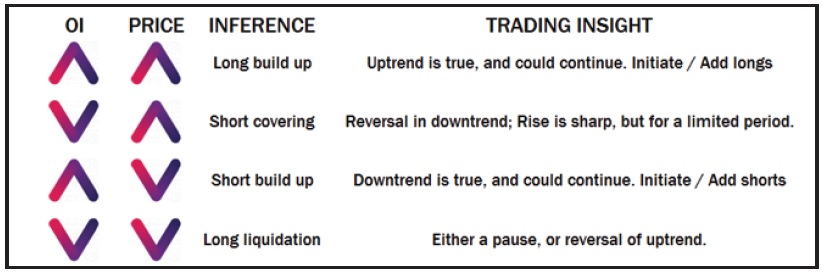
Since the afore mentioned insights are conventional and widely followed by traders, the chance of making a meaningful trade out of them is low unless you squeeze the data for more insights. Here are four of them:
Identifying a broad trading range
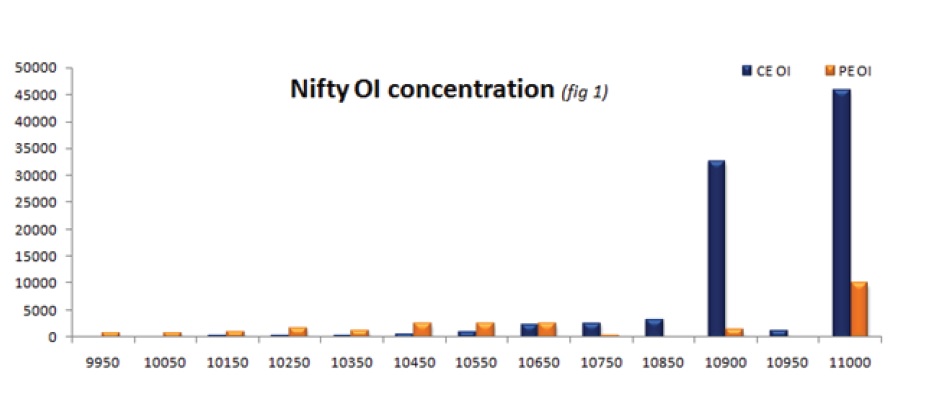
To the end that put options price-in negative expectations and call options price-in the positive expectations, the strikes where OI activity is high, gives a fair idea as to how far the traders are expecting the stock/index to fall or rise, thereby outlining a broad trading range for the stock/index. The strike with maximum put open interest will act as the lower extremity of the range and the strike with maximum call open interest will act as the upper extremity of the range. For example (see the fig), the open interest concentration chart shows that maximum Put open interest is at the 10000 strike which will form the lower extremity and maximum call open interest is seen at the 11000 strike which forms the upper extremity of the range.
Identifying supports and resistances
Identifying support and resistance is a subjective study and needs deeper analysis of open interest dynamics. What we generally see in the market is that the option writers have an edge whenever the index takes a directional tilt. Call writers will be active when the market plunges and Put writers will take control when the market surges. Persistent Put or Call writing at a particular strike will mean that the strike is supposed to act as a key support or resistance level. If the writing is not persistently focused on a particular strike and rather it is distributed across a range of strikes then this theory may not work accurately. Ideally in such a scenario you may look for a strike that holds considerably higher open interest along with high put or call writing as the support or resistance level. Even though not frequently seen, persistent put long build up or call long build up at an out of the money (OTM) strike could also mark as the support or resistance level of the underlying.
Gauging volatility expectations
Volatility expectation is directly proportional to the width of the open interest concentration range. That means, wider the strikes with maximum Put and Call open interest is located higher would be the chances of volatility. In the example here, we could trace a 1000 point range between the strikes with maximum Put (10000 strike) and Call (11000 strike) OI, as against a normal trading range of 300 – 500 points. Such a higher range suggests potential for higher volatility in the near term. These insights are important in choosing between different option strategies, say between long guts and a long strangle, or between short straddle and long straddle.
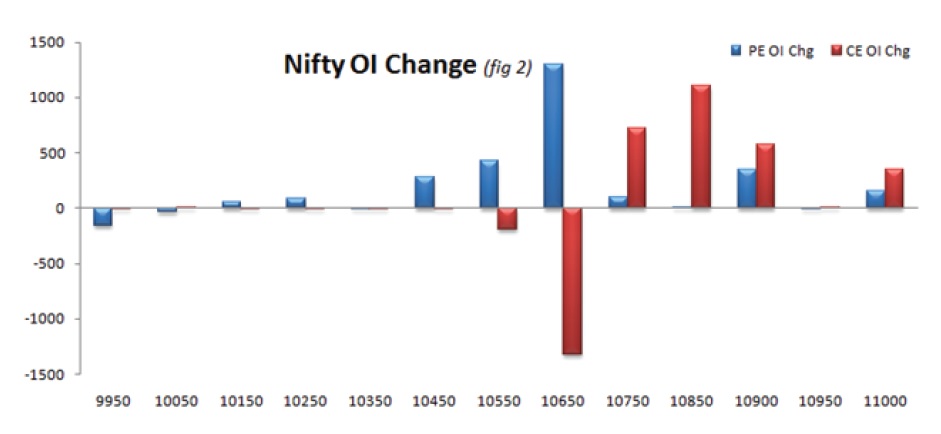
Identifying the establishment of trend or its reversal.
This is a subjective analysis and requires deeper understanding of the open interest dynamics, as trending markets show peculiar patterns in the open interest. Futures in a persistent downtrend are seen to build a cycle of short build up and short covering rally. That means, it will build up short positions and in the interim these shorts would be covered. And vice versa for long build up and long liquidation, during an uptrend. Such cycles continue till the stock takes a directional turn, which can also be identified by the break in the aforementioned pattern.
OI analysis does not stop with these four of course, but they are necessary studies for all derivative analyses.


