
By Mahesh Vyas
During the quarter ended June 2018, listed non-finance companies added Rs.237 billion to their closing stock. This is an exceptionally high value in comparison to the trends in the past five years.
Net sales of non-finance listed companies grew by about 19 per cent in the June 2018 quarter compared to their performance a year ago. This is an impressive growth rate as it is much higher than in any quarter in the past six years.
This acceleration was caused essentially by a sharp increase in commodity prices. But, high commodity prices is a double-edged sword. It can increase the sales of some companies, but by the same measure, it can increase the input cost of others.
Financial statements of non-finance companies do reflect this. While net sales increased by 19 per cent, operating expenses increased by 20.4 per cent and raw material expenses shot up by 24.1 per cent. Power and fuel expenses shot up by 29 per cent. These again, were the highest growth rates seen in the past six years.
Wages and salaries grew by a modest 9.6 per cent. The wage bill growth rates have been mostly in single digits since 2014. This reflects partly low inflation rates that have helped keep wage expectations low and partly it reflects the low increase in headcount because of low investments.
Expenses on outward freight and other distribution expenses have shown a surprisingly high rate of increase in recent quarters. Part of this could be because of higher fuel costs of transporters. But, the introduction of GST should have reduced costs as well. But, these expenses grew by 24.5 per cent y-o-y in the quarter ended June 2018, after having recorded a 21 per cent increase in the March 2018 quarter and 28 per cent in the December 2017 quarter.
There is a sharp drop in the number of companies disclosing the amount of indirect taxes paid. On an average 30 per cent of the companies disclosed indirect taxes paid during the four quarters just preceding the introduction of GST in June 2016. This ratio dropped to less than three per cent in the four quarters following the introduction of GST.
Expenses grew at a faster clip than sales in the June 2018 quarter. Companies were building up substantial inventories by the end of the quarter. Operating expenses corresponding to sales grew by 17.2 per cent compared to the 19 per cent growth in sales revenues. As a result, profits before depreciation, interest and taxes grew by a robust 28.7 per cent.
During the quarter ended June 2018, listed non-finance companies added Rs.237 billion to their closing stock. This is an exceptionally high value. Companies can draw down from stocks or add to them depending upon their perception of business conditions.
In the 20 quarterly aggregate financial statements of the past five years (June 2013 through March 2018), listed companies have drawn down stocks half the time with a maximum draw-down of Rs.123 billion which was in the quarter ended December 2014. And, the maximum that they have added to stocks is Rs.177 billion, which was in the quarter ended June 2016.
Interestingly, in the preceding 32 quarters (June 2005 through March 2013) corporates drew down stocks only during the two quarters immediately after the global financial crisis of 2008. The recent flip-flop of stocks is instructive in its own way. But, for now, we revert to the current build up.
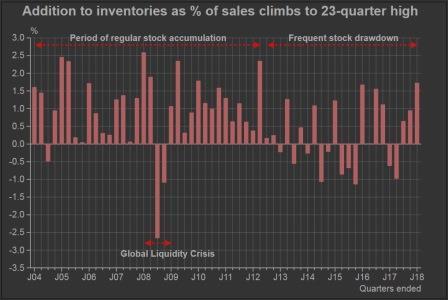
The Rs.237 billion addition at the end of June 2018 is therefore quite high in comparison to the trends in the past five years. It is the highest buildup and is comparable to the Rs.253 billion stock addition in the quarter ended September 2012 which marked the beginning of uncertain times for Indian corporates.
The commercial vehicles industry shows the largest addition to stocks compared to its history of its past five years. The maximum addition to stocks in manufacturers of commercial vehicles during any quarter in the past five years was Rs.9.3 billion. The addition to stocks in the June 2018 quarter was more than twice that maximum, at Rs.19.8 billion.
Commercial vehicles has also seen a very sharp increase in sales during the June 2018 quarter. The industry not only increased sales volumes but also built up substantial inventory by the end of the quarter.
Fertilizers showed a similar spike in stocks. Although fertilizer companies do see a stock buildup in the June quarter this year, the buildup was much more than in the past.
Steel, retail trading, general purpose machinery and readymade garments are some of the other industries that saw a spike in inventories during the June 2018 quarter.
To remove the effect of inflation in the time trend of stocks buildup it is useful to deploy the ratio of change in stock to net sales. In the June 2018 quarter, the net change in stock of listed non-finance companies was 1.72 per cent of net sales. This again, was the highest in six years. And by this measure it was commercial vehicles, readymade garments and general purpose machinery that show the most buildup of stocks.
Benign increases in interest expenses, depreciation and other provisions helped profit before tax record a handsome growth of nearly 43.7 per cent. And, profit after taxes grew by an equally handsome 41 per cent. But, profit growth is a fickle measure. It can easily change dramatically. The handsome growth of 43.7 and 41 per cent were partly the result of a 22 per cent and a 27 per cent fall, respectively, in the year ago quarter.
How would this growth pan out in the coming quarters? This depends on whether companies built that inventory to feed growing demand or whether they were left with large inventories because demand slowed down towards the end of the last quarter. We also need to see if topline growth sustains its momentum independent of the commodity prices cycle?


