
When it comes to investment and savings, most people face the dilemma of how to form a portfolio of assets that would help them in maximizing their returns. Unlike in the past, individuals have access to different forms of assets to invest their wealth viz financial and physical assets. Though investment in financial assets is gaining popularity, in India, physical assets viz gold and real estate are still considered to be the most preferred form of investment. As per Reserve Bank of India’s Committee on Household Finance (2017), average Indian households hold 84 percent of its wealth in real estate and other physical goods, 11 percent in gold and the rest 5 percent in financial assets.
Here, an analysis is done to understand which form of the asset class has yielded maximum returns.
Real Estate Sector
In order to assess the performance of the real estate sector, the movement of the Housing Price Index (HPI) is considered. It could be seen that the YoY growth rate of housing prices has registered a fluctuating trend with the highest rate of 26.3 percent in Q3.2011-12 and the lowest rate at 3.3 percent in Q4.2015-16. However, from Q4.2016-17 onwards a continuous declining trend in housing prices is evident. The YoY growth rate has declined from 10.5 percent in Q4.2016-17 to 5.3 percent in Q1.2018-19.
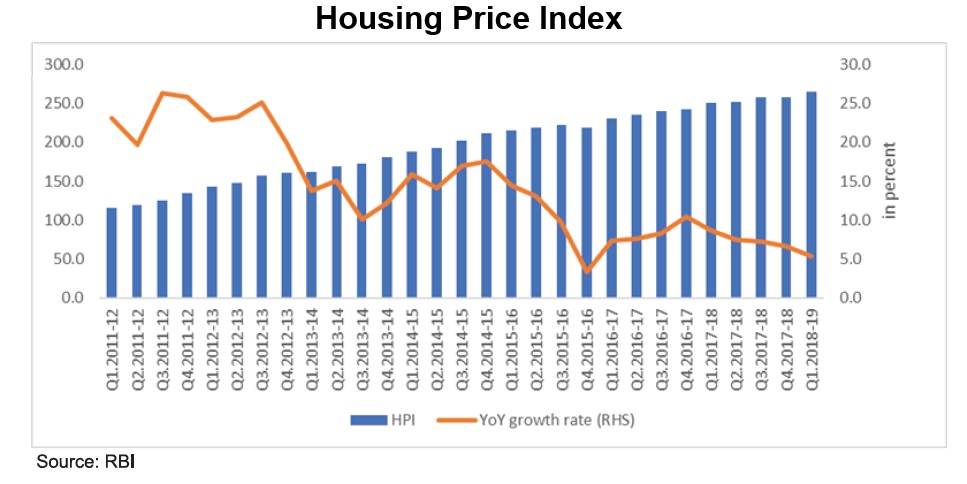
The YoY growth rate of HPI for the Indian cities also presents a similar picture. The table given below presents the YoY growth rate of HPI for 10 cities from Q1.2011-12 to Q1.2018-19.

When YoY growth rate in Q1.2011-12 and Q1.2018-19 is compared, it could be seen that the growth rate of housing prices in the major cities has registered an unsatisfactory performance. For instance, YoY growth rate of HPI for Delhi in Q1.2011-12 was 25.9 percent and it declined to -0.1 percent in Q1.2018-19. During the same period, the YoY growth rate for Kolkata has declined from 32.2 percent to 1.2 percent. Some cities have also performed well during this period. For instance, the YoY growth rate of HPI for Chennai was -1.4 percent in Q1.2011-12 and 9.6 percent in Q1.2018-19.
Gold
Gold is considered one of the safest forms of investment. Due to social and cultural factors, Indians have a special sentiment towards gold. The high import of gold is cited as one of the major factors for the country’s widening current account deficit. The gold prices, influenced by both domestic and global factors, registered a fluctuating trend in the past years.
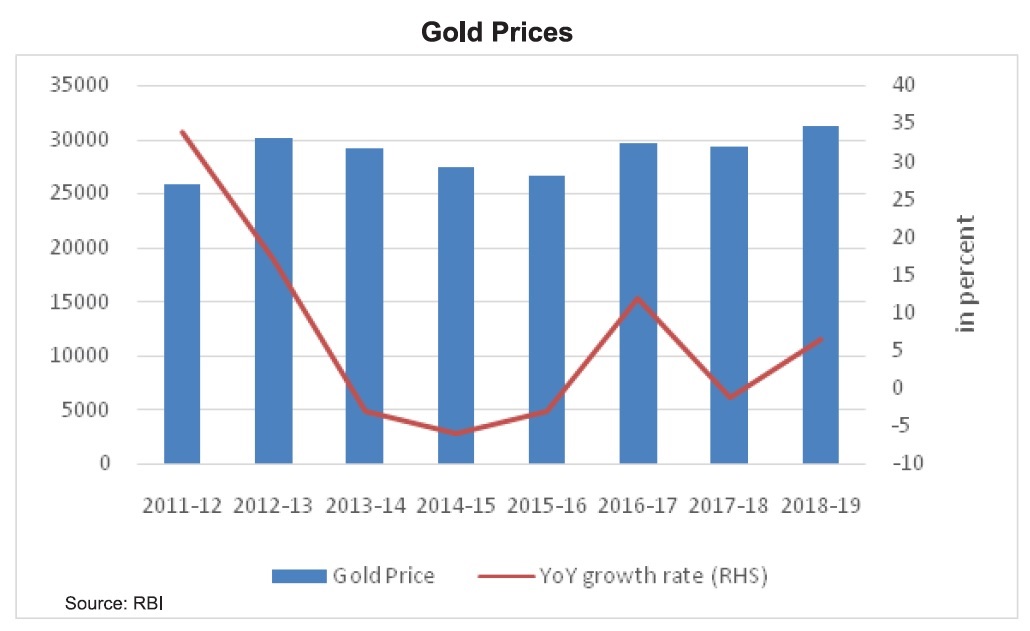
Between 2011-12 and 2014-15, gold registered a continuously declining trend in YoY growth rate before picking up in 2015-16. Gold quoted its highest price in 2018-19 at Rs 31193 registering a YoY growth rate of 6.46 percent. The lowest growth rate was registered in the year 2014-15 at – 6 percent.
Stock Market
As per the study conducted by NCEAR in 2011, it was found that only 24.48 million households in India invest inbond, debenture, mutual fund, IPO, derivative and secondary market. It shows that only around 10 percent of the total households in India invest in the above instruments. Here the analysis focuses on the performance of the stock market in India. SENSEX is taken as the parameter to assess the performance of the stock market.
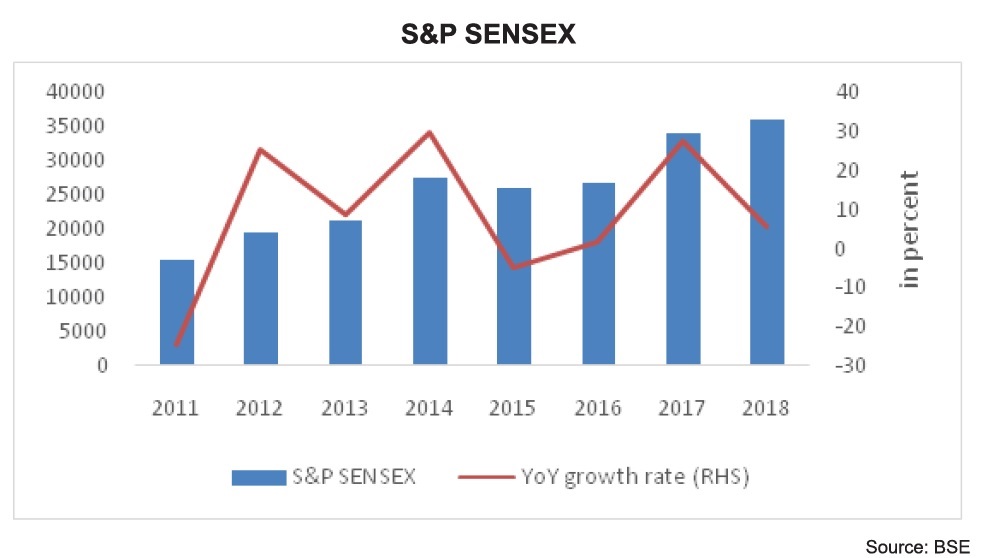
S&P Sensex registered a fluctuating trend in the past years with the highest growth rate registered in 2014 at 29 percent and the lowest in 2011. The year 2017 witnessed a double-digit growth rate at 27 percent with SENSEX climbing up from 26626 in 2016 to 34056 in 2017.
And the winner is?
Compound Annual Growth Rate (CAGR)[i] is calculated for the above three assets, to understand which asset yielded the maximum returns for the given time period. CAGR was found to be 3 percent, 11 percent, and 12 percent, for gold, real estate sector and stock market respectively. The numbers show that stock market yielded the maximum returns in the given time period. However, the share of wealth invested by Indian households in the stock market is negligible compared to the share invested in real estate and gold.
With Indian households having their largest share of wealth invested in the real estate sector, the performance of the sector is indeed worrying. With rapid urbanization and large-scale migration to cities, there has been an increasing demand for houses in the major cities. Even in such a scenario, YoY growth rate of HPI is declining.It is important to note that housing prices have registered a single digit YoY growth rate consecutively for the last five quarters.
[i]CAGR for HPI was calculated from Q1.2011-12 to Q1.2018-19. For gold and SENSEX, CAGR was calculated from 2011 to 2018.


