
Understanding volatility
Volatility means many things to many people. As far as investments are concerned, one cannot but dispute the fact that the talk about volatility usually carries an air of unpleasantness. When there is too much of it, as well as when there is too little of it.
Let us quickly flip our chemistry books, to look at an alternate meaning of volatility. There, it refers to volatility as how readily a substance evaporates at room temperature. So, a highly volatile substance is less likely to exist as solid or liquid and will vaporize, while a low volatile substance tends to condense and become a liquid or solid. In other words, volatility is pointing to a phase change, which is not too different from how it is dealt with in finance.
In stock markets, our
ability to understand volatility is connected with our understanding of the
phase that we are in. A common investor who expects his returns to rise, and be
steady at that, can be said to be in a phase of optimism. An event that alters
such optimism or visibility regarding future returns, hence becomes a
source of volatility. It must be noted here that a pull back or a brief rise in
a steady downtrend, is seldom perceived as volatility, even though it is a
change from the established downtrend.
The risk
The real risk about volatility studies is our tendency to not only associate volatility with risk, but use the terms interchangeably, since volatility remains a very popular way of quantifying risk. The general negative connotation around volatility has conditioned us to think that once volatility is tamed, the markets’ superlative returns is ours to reap. There isn’t a truth farther from that.
Imagine two stocks ABC and PQR having the following volatility profile.
Stock ABC rises up to 1percent, 33 percent of the time, falls up to 1 percent, 33 percent of the time, and moves more than 1 percent, rest of the time.
Meanwhile, stock PQR also rises up to 1%, 33 percent of the time, falls up to 1%, 33 percent of the time, but rises more than 5 percent, rest of the time.
Clearly, with a larger move of more than 5 percent, stock PQR is more volatile. But is it riskier? Stock ABC, though apparently less volatile is clearly riskier from a returns perspective, as it loses more than 1 percent, one third of the time.
Think or Swim
Coping with volatility is a bit like learning to swim. If you think too much, you risk getting too technical and miss getting the sense of buoyancy altogether. Similarly, with volatility, there are any number of ways to get this complicated. You could take the option pricing route, or that of standard deviation, build multiple indicators around these, or just build an emotional barricade whenever you hear about volatility, shutting everything out.
Once you have learned to swim, those very factors that had proved to be stumbling blocks just fade away, and all you end up thinking would be the laps that you are to do, or the styles that you are to try out, or just relax without much ado. Similarly, in stock market terms, once you begin to see volatility for what it is, it becomes a tool to mine an opportunity.
The concept of volatility is a hot theme for option traders. Option buyers look for potential for rise in volatility or IV (Implied Volatility as used in option terminology), as IV expansion happens with increase in option price. Option sellers on the other hand, look for parameters like IVR (IV Rank), IVP (IV Percentile), HV (Historical Volatility), theta (days to expire) etc., and see if there is potential for decline in IV, as IV contraction goes hand in hand with premium decline.
For stock traders, volatility presents opportunity for bargain hunting, which in turn provides depth and stability to the counter. This function is akin to the what ACL, PCL and LCL (ligaments) does for a knee joint, which by providing feedback when stretched to extremes, knee joint can re adjust to maintain stability.
Let us put aside the option and stock traders, and see if a normal investor can address volatility.
One is SIP, the so popular way of systematic investment. SIPs are popular, because it is simple and devoid of any complex calculations, and without the urgency of taking time and price sensitive decisions, having mandated to buy for a specific amount at a specific interval. In other words, one does not require to worry about whether the stock is in an uptrend or downtrend, even while utilizing the dips that come by improving the average buy price.
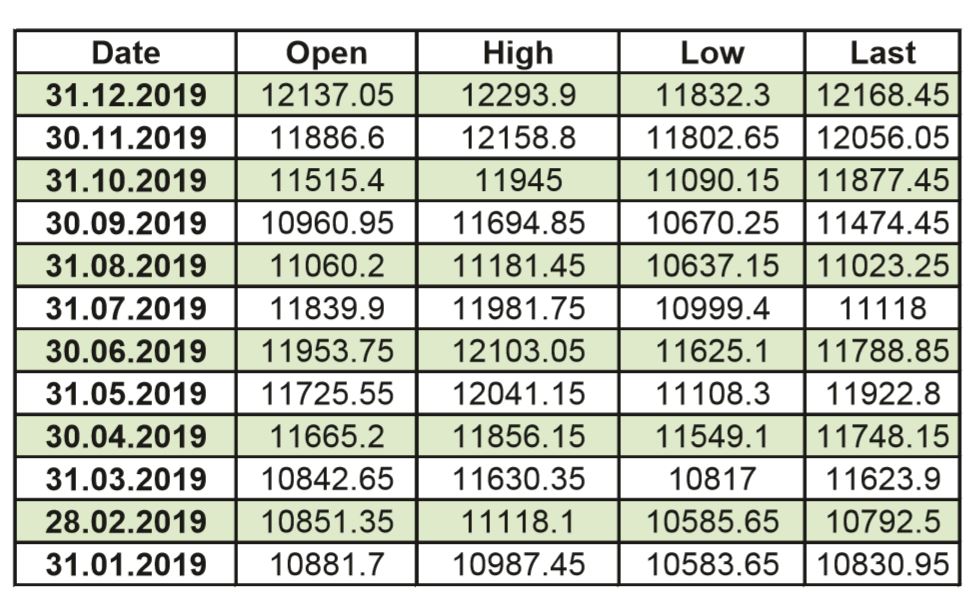
For convenience sake, let us assume that the investor made a systematic investment in Nifty 2019 by buying one lot of Nifty at the last traded price of first 10 months, and sold it at the last traded price of December 2019.
So the invested amount would be: 1,142,00.3 =(10830.95+10792.5+11623.9+11748.15+11922.8+11788.85+11118+ 11023.25+11474.45+11877.45), and the sale amount would be 121684.5 = (10 x 12168.45), giving a return of 7484.2 or 6.55%.
Note that this return has come with no fund manager involvement or other assistance, so this is arguably the best trouble free and effortless money that you can make. Now, the question is could the investor have made more money had he made some simple allocation for volatility?
Let us make a simple adjustment to introduce volatility into the investment, by deciding to buy 5 units of Nifty at the start of the year, and the rest of the 5 units at any point that is 10 percent below the year’s peak. This would mean that five units are invested at 10830.95 and the other five at 10892.7 which is 10 percent below the year’s high (during the investment period) of 12103.05 seen on 3rd June 2019.
So the invested amount would be 1,08,618.25 or (54463.5 + 54154.75) and the sale amount would be 1,21,698.5, giving a return of 13066.25 or 12.02%, which is almost double that of the first method.
Suffice to say that value investing begins by embracing volatility.


