
The historic rise in stock market participation in the last year, has also led to an increasing popularity of Technical Analysis, hitherto the domain of analysts and seasoned traders. In this context, let us talk about “Parabolic Stop and Reverse” or just PSAR which is yet to become as popular with the new age investors, as much as it is with the analysts. It was first introduced by Welles Wilder in 1978, and that it has stood the test of time, is a testimony to the quality of the indicator. The unique name is not the only feature that differentiates it from other popular indicators. When displayed on a chart, it looks like steps leading down along with the price on a downtrend and leading up while the price trend is up.
How does it work?
In general, PSAR helps to identify the trend and alerts them about the entry and exit levels.
The PSAR steps would be below the price candle in an uptrend and above the price candle when prices move down. Parabolic SAR steps would be closely placed on charts initially but as the price moves up or down the distance between the steps starts to increase and the highest difference is seen when big moves happen in the stock price on subsequent days. Due to the complex nature of the calculations, it is not easy to illustrate the working here, but the basic formulae areshown below, to give an indication as to the makeup of the indictor. This would interest only a connoisseur, as PSAR can be easily inserted in any of the new age charting tools, without having to worry about the technicalities.
Calculation
PSAR in uptrend- Prev. PSAR + Previous AF (Prev. EL – Prev. PSAR)
PSAR in downtrend – PSAR – Previous AF (Prev. PSAR – Prev. EL)
EL(Extreme level) – Highest/lowest level in the last uptrend or downtrend.
AF(acceleration factor)-02 is set as default with a maximum of 0.2

Parabolic SAR in use
When to enter
The conventional approach to use PSAR is to look for price moving above or below the SAR steps as means to pick the entry and exit signals respectively. It does not generate a signal on a daily basis but once a signal is generated, the trader is expected to hold on to the positions until a reversal happens. Reversal of an uptrend is indicated when the price moves below the ongoing PSAR steps. In Chart 1, we can clearly see that when the price moves above the previous PSAR step, a new PSAR step is generated below the price and the price continues to move up. Infact, PSAR could also give entries ahead of actual price breakout as you can see from the chart above, which shows a PSAR buy days ahead of price breaking out of the sideways trend.
When to exit
PSAR signals not only give you an entry point but also exit levels. A break of PSAR by price in the opposite direction is considered an exit signal. In the example given here, you can see that the PSAR that gave a buy signal around 1060 continues to support the trend, until a reverse was seen around 1320, and PSAR started forming above the price. Post this, the stock retracted into a sideways trend, rendering PSAR signals susceptible to whipsaws. Obviously, there were trading opportunities, but using PSAR would have led to false entries or hurried exits.This example also shows that PSAR also holds good as a trailing stop loss, which is a level that you can keep moving up, in order to protect your profits. Here the trader can continue to hold on to the stock with a stoploss trailed just below the PSAR value. In this example, the trailing stop loss would have been placed at 1320, which would have protected about 24.5% returns since the last PSAR buy signal.
Backtesting
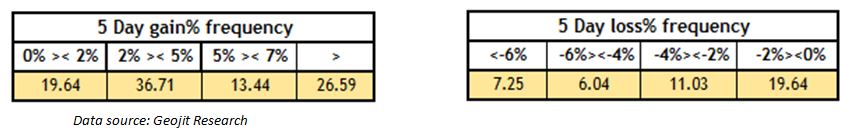
On analysing NSE stock, in the last 8 months, PSAR generated a ‘BUY’ signal 662 times. Of those 662 observations, 77% of the stocks gave more than 2% returns and 40% of the stocks gave more than 5% returns in the next 5 days.
Conditions to look out for
PSAR signal should be followed only once a trend is established. In a sideways market, traders may get many PSAR trading signals but as the trading range has not been big enough the PSAR signal might confuse traders and lead to wrong entry/exit opportunities. In technical terms, this condition is called whipsaws, false trading signals.
Improvisations
- As discussed earlier, the default sensitivity of PSAR is set at 0.02 and a maximum of 0.2. An experienced trader might look to alter these sensitivity figures so that the stock reacts quickly or slowly to the price change. Traders may do these when they are trading in certain instruments which require such tweaks depending on the volatility of the instrument. If the instrument is a volatile one, we often choose to increase the sensitivity of PSAR by increasing the AF value and vice versa.
- The whipsaws can be reduced by getting an identifying trend better by using moving averages or ADX alongside.


