
No, this article is not about how accurate Nifty is, as a benchmark for India’s economic growth. We know that it is not. But for the naysayers, let us settle the argument first. It is not what the article is about though, but first things first.
Auto sector: What were some of the major change agents the sector has witnessed in recent times? Shift to BS VI norms? Electric vehicles deadline? NBFC crisis? All of them have been significant change agents, but none have stricken at the root of car ownership or usage as much as the taxi hailing apps. Now, are Uber and Ola listed? No. Now, you know where I am going with this. Retail Sector: You do have Shopper stop, Trent, Dmart, etc. in the listed space. But, hey, where is Amazon? Flipkart? Or Paytm, Zomato, Swiggy, Jio to name a few?
Why not in equity?
The question in fact should be why. Why are they and similar behemoths, or fast growing companies that are changing the economic landscape of the country not seen in the listed space anymore? Now, equity is traditionally seen as a low cost as well as easy source of finance, when compared to debt. For variety or reasons, well documented and otherwise, companies are increasingly tapping resources outside of the equity market, then it is assumed that PE, VCs and other such sources are offering easier access to capital, in spite of the associated risks and pressures from such promoters. Now if more and more companies are not accessing equity markets for finance, then that pretty much puts in jeopardy, the standing of “market cap to gpd ratio” as a decent indicator towards market performance. As of March 2019, Nifty 50 represented ~67% of the total free float market capitalisation of all listed equity companies on NSE. In simple terms, it means that just because Nifty 50 stocks constitute the bulk of NSE market cap, it does not follow that they contribute similarly to GDP as well.

Nifty in the last 10 years
7.71%, the returns per annum from Nifty, in the last 10 years (as on March 29,2019), if the investment in Nifty was done in an equal weighted manner (2%).
11.46%, the returns per annum from Nifty over the same 10 year period, if the investment in Nifty was done in proportion of the constituent stocks’ market capitalization.
15.98 %, the return per annum from Nifty Total return index over the same 10 year period. This is as high it could get, as it captures not only capital appreciation, but also assumes that cash distributions like dividend, bonuses etc. are re invested. But the key point here is that, the index constitution does not remain static. Weak ones are left out, and companies that are showing strength, are added as per its semi-annual routine. In other words, index is primed and well-groomed to succeed; to give good returns. Incidentally, the returns also compare fairly with the ~13% growth in GDP in nominal prices in the similar period (FY09-2019E).
So, a rule based index rebalancing done by Index managers improves the returns over a conventional set up of investing with equal weightage and forgetting for the next 10 years. Quite Darwinian. Survival of the fittest and all…Fair enough.
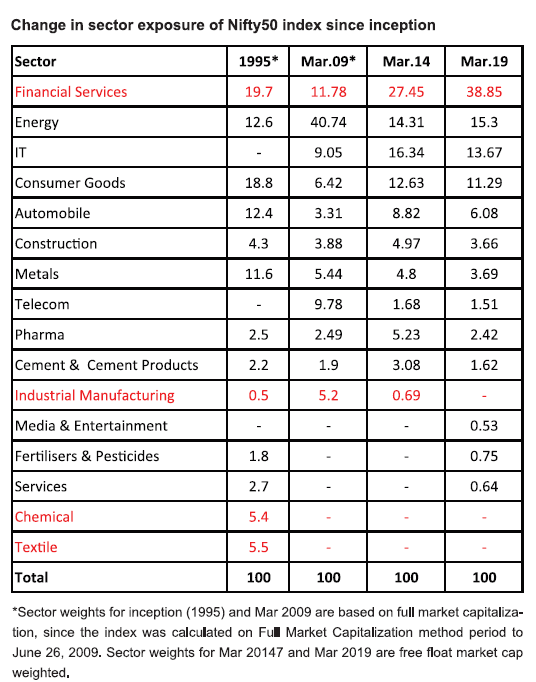
Index composition since Index’s inception in 1995
20%, the proportion of financial sector in Nifty. It rose to ~27% by Mar 2014 ie in 19 years, but in the next 5 years it ballooned to a whopping ~39% in Mar 2019.
0%, the presence of Information Technology at inception. This rose to nearly 14% as on March 2019, reflecting its position among the key drivers of economy.
Flawed but…
So, in reality, Nifty50 does not fairly reflect emerging companies/sectors, nor act as a barometer to economy, but it is certainly a proxy. It is to be hoped that those fast growing companies that have opted for other sources of funding will be seen in the listed space, once they are done with the cash burn models and see stability. And thus in turn, set the equation between market cap and gdp right again. And also in turn, normalize the excessive concentration seen in certain sectors. A white paper on Nifty 50 Index reckons that 68 percent of the active funds which use NIFTY 50 have not been able to beat the index over the last 10 years. Even after ignoring the fact that this comparison obviously excludes the mid cap funds where superlative returns are often seen. Nifty, which follows a simple rule based approach, delivered a decent 15.8% in the last 10 years, and hence it still carries its weight in gold.
Reference: White paper on Nifty50, nseindia.com


In the 80 s & 90 s households /individuals used to invest in equities .
They were systematically eliminated by Financial institutions domestic & Foreign.
Now you find the Institutions loosing all the hard earned money of the individuals and you call
it recession ?