
 By Laxmi Priya and Sheen G
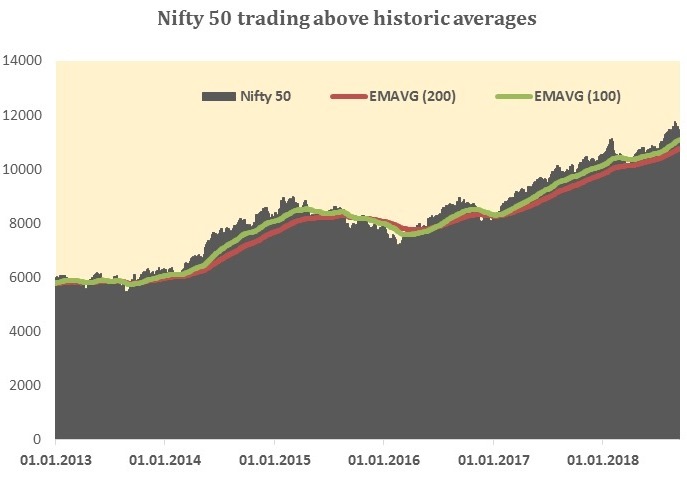
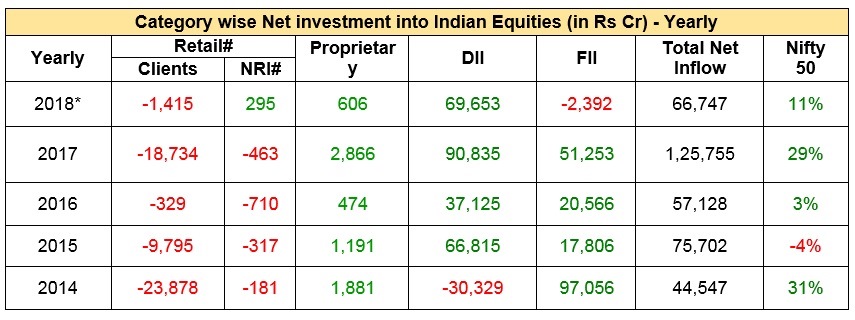
Till 2014, Indian equity market was largely dependent on foreign institutional (FIIs/FPIs) inflows, which contributed to a major part of the liquidity. From 2015 onwards, the quantum of foreign investments reduced significantly by around Rs80,000 cr in CY15 compared to previous year on account of U.S Fed rate hikes and reversal in Quantitative Easing. Repercussions were witnessed in the Indian market which led Nifty to fall by -22% from a high of 8,891 in March 2015 to a low of 6,961 in February 2016. However curtailing the fall, a new liquidity trend was seen in the Indian market: a considerable rush of funds from local institutions/ the DIIs (comprising Banks, Insurance companies, New Pension Scheme and Mutual Funds) started flooding the domestic markets. This was led by substantial increase in inflows via the mutual fund route (a major component of DII investment) leading to surging AUM (Assets under management) growth. Lacklustre returns in traditional avenues like gold, real estate and bank deposits persuaded the risk averse middle class investors to consider other options. Reduction in interest rates from 2013 onwards led the bank deposit yield to gradually drop to single digit over the last few years, driving retail investors to flock towards equities largely via professionally managed Mutual funds (MFs). This marked the start of matured equity participation by retail investors with a change in their investment strategies from physical assets to financial assets. Even after the double whammy of demonetisation and GST, markets saw higher retail participation via the SIP (Systematic investment plans) route in equity linked mutual funds. Interestingly, direct retail participation (mainly clients) saw continued offloading in Indian equities since 2009. However, retail participation via SIP rose significantly with inflows totalling of Rs7,658cr in the month of August 2018, a surge of 47% compared to Rs5,206cr in August 17. The steady, solid participation by mutual funds have considerably helped to negate the impact of FII outflows, balancing liquidity conditions, and pushing benchmark indices above their historic averages.
The graphic representation of major participants driving liquidity and market performance is shown below:
FIIs shift focus into Primary markets via IPOs, driving AUC (Assets under Custody) growth…
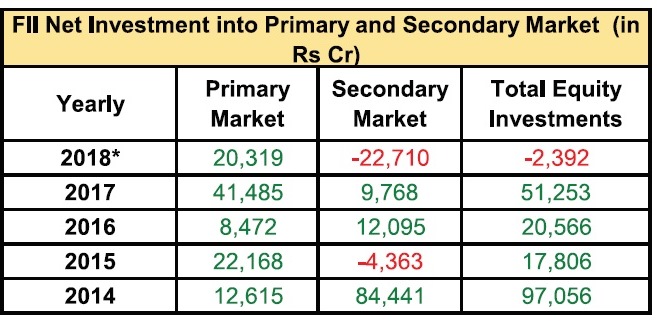
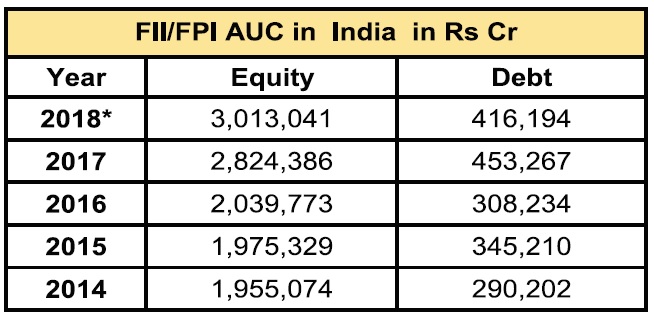
Increased FII participation in Indian primary markets… Though FII investment fell largely during 2015-18 in Indian secondary market, they were still strong participants in the primary markets. FIIs pumped in Rs 20,319cr in primary markets in 2018 compared with net outflow of Rs22,710cr in the secondary markets. This led to 6.7% rise in FIIs AUC in equities (Secondary and Primary markets) to Rs30,13,041cr in 2018 (till Aug 2018) vs. Rs28,24,386cr in 2017. However, in debt funds, holdings reduced substantially by around Rs37,073cr in 2018 to Rs 4,16,194cr vs. Rs4,53,267cr in 2017 led by reduced flow of FII debt funds from Mauritius and Singapore during Jan –Aug 2018 period.
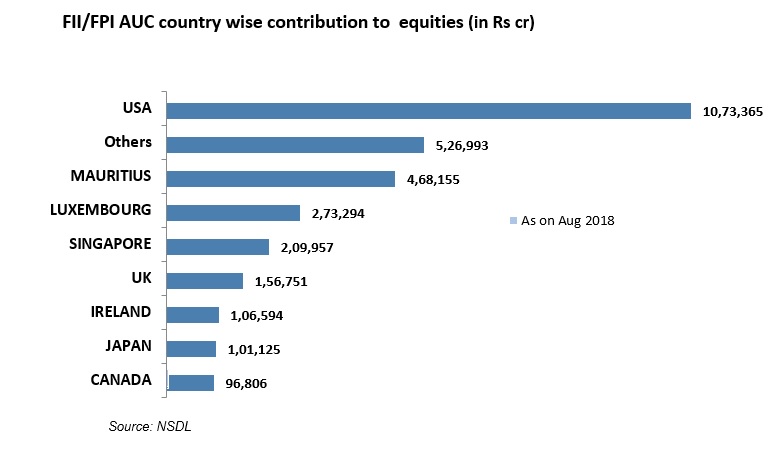
Top Country-wise AUC into Indian Equities: Among FII investments from top countries into Indian Equities, holdings from USA (36%) tops total holdings, followed by Mauritius (16%) and Luxembourg (9%) as on Aug 2018.
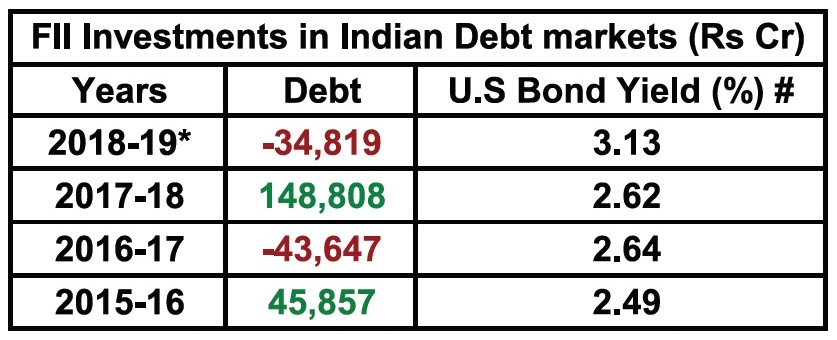
Heavy selling by FIIs in Indian Debt markets…
The yield on 10- year U.S govt. bond surpassed the 3% mark this year propelling FII outflow. Moreover, rising crude prices pushed up India’s current account deficit (CAD) to $15.8bn or nearly 2.4% of GDP in Q1 2018-19 and is further expected to rise to 2.6% of GDP (source: IMF) in current year. Widening deficit resulted 10% fall in rupee on YTD basis affecting FIIs return.
FII Sectoral play: Monthly Net investments at a glance…
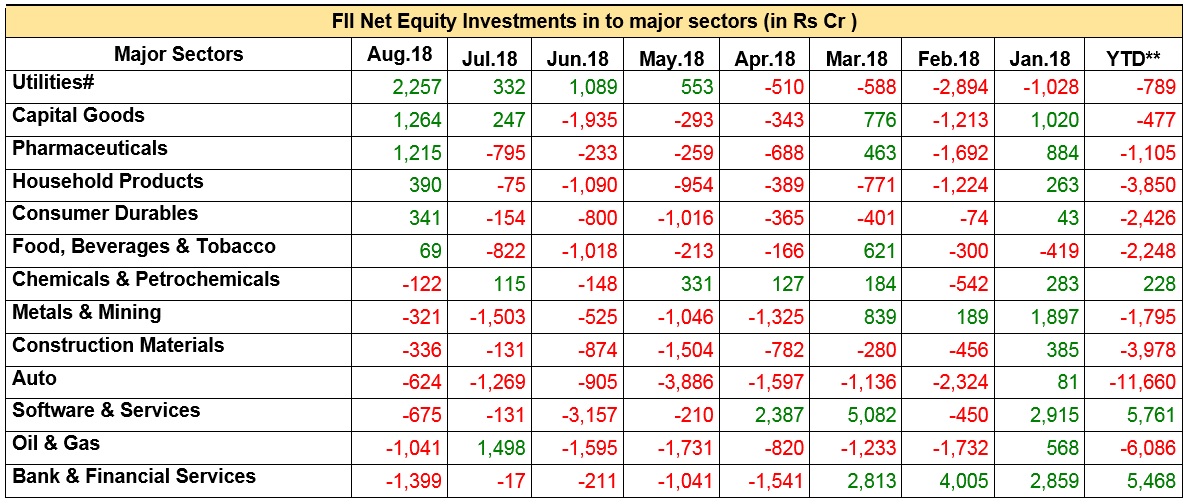
Consumer oriented sectors like Food & Beverages, Consumer Durables, Household, and Pharma on an YTD basis witnessed sharp selling by FIIs. However on a monthly basis, mixed investment behaviour was seen with FIIs turning positive in Pharma, Household, and Consumer Durables. Commodity-linked sectors meanwhile continued to be under selling scanner due to sharp surge in oil price.
- Utilities sector continued to enjoy robust buying fervour for the fourth consecutive month. However, YTD basis, net outflows amounted to Rs-789cr.
- Auto sector witnessed severe selling pressure by FIIs for the seventh consecutive months in 2018 due to price war and high valuation.
- Metals continued to register net outflows for five straight months.
- Bank & Financial Services witnessed sharp selling since April, despite inflows totalling to Rs5, 468cr on a YTD basis.
- IT sector inflows totaled a robust Rs 5,761CR on an YTD basis, however, the sector remained under scanner since May 18.
FII Investment among Emerging Markets (EMs)…
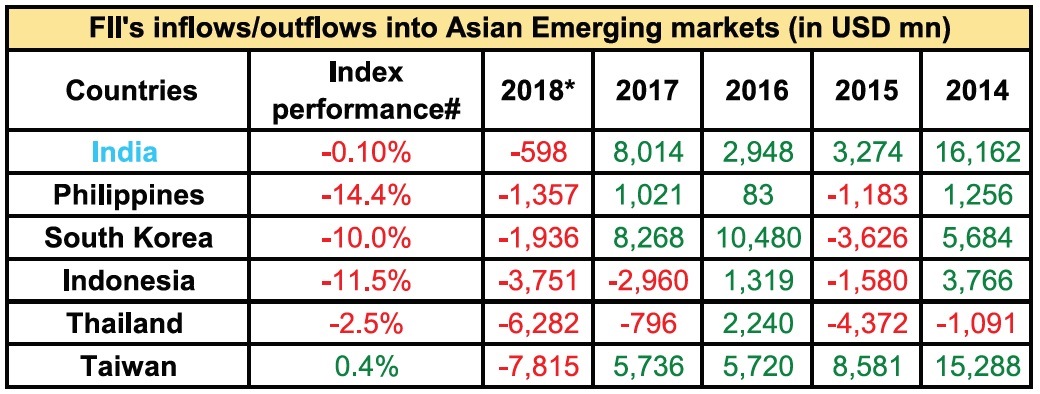
- India has emerged as the preferred choice for FIIs compared to other Emerging markets. However, FIIs inflows in India were minuscule compared to the outflows seen during the rest of the year.
- Among major Asian emerging markets, Taiwan, Thailand and Indonesia witnessed the largest foreign fund outflow in 2018 (so far) followed by South Korea and Philippines. Indonesia and Thailand continued to be under FII selling scanner for the second consecutive year.
- Among EMs, rising crude prices, higher US bond yields, trade war tensions between US-China and other economies escalated outflow of foreign funds, increasing demand for the US dollars which resulted in depreciation of many EM currencies against US dollar, adding to volatility in the emerging equity markets.
Will FII inflows gather steam again? Despite recent turmoil in emerging markets, Indian equities have largely been unaffected led by robust domestic flows (especially Mutual funds). Benchmark index (Nifty50) rose 12% YTD in rupee terms supported by better earnings in the first half of this fiscal. However, in US dollar terms, the index growth was merely -0.1%. Performance of most of the Asian emerging market equity indices were on the negative side with Philippines (-14%) and Indonesia (-12%) at the worst end (in USD terms). FIIs are likely to take a cautious approach in emerging markets on account of rising crude prices, weakness in currencies and higher bond yields in US. Also, higher volatility is anticipated in Indian markets due to upcoming general elections and concerns regarding Fed tightening.
Mutual fund-led DIIs: propelling markets to new highs…
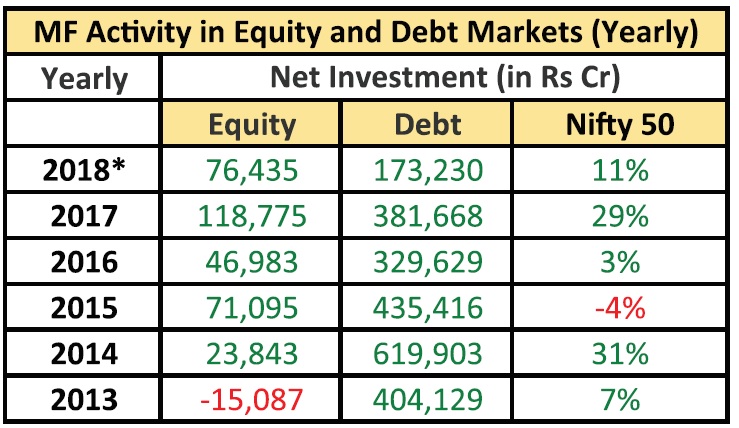
- Irrespective of FII selling seen in Indian market this year, domestic institutional investors (DIIs), dominated by Mutual funds have continued to extend their buying in Indian equities.
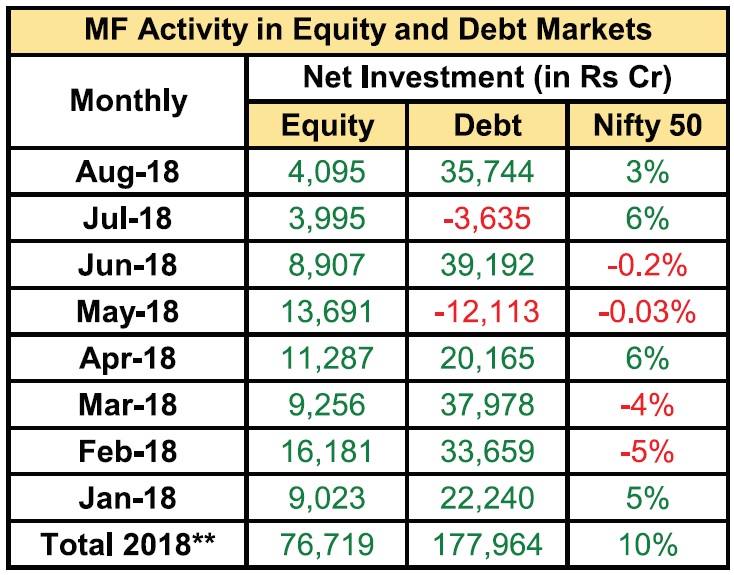
- Mutual funds have bought funds worth Rs 76,435cr in equities (till Aug 2018) and a robust investment of Rs1,73,230cr in debt.
- However, monthly investments have tapered to Rs4, 095cr in Aug 18 compared to investments in the start of the year.
- July and Aug 18 marked the lowest MF investment in Indian equities in 2018.
Sectoral deployment of equity funds by Mutual Funds (AUM)…
As per AMFI (Association of Mutual Funds in India) sector classification, Mutual funds equity holdings are split across 39 sectors. As of July 2018, of the total 39 sectors, five sectors enjoyed highest increase in deployment of funds by MFs: Banking & Financial (31.35%), Software (8.19%), Consumer Non-durables (7.46%), Pharma (5.74%) and Auto (5.52%).
The table gives snapshot of Mutual fund allocation of equity into major sectors:
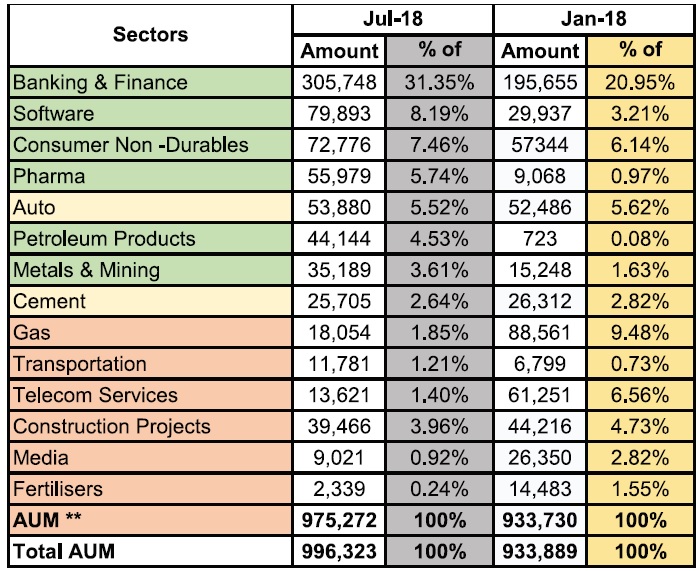
 In Banking & Finance, MFs deployed 31.35% of AUM in July18, a surge of 56% compared to AUM in Jan 18. Of the total AUM holding of Rs 3,05, 748cr in July 18, 20.67% of AUM were from Banks while Finance accounted for 10.68%. MF exposure to software, Metals & mining jumped 167% and 131% during Jan-July 18. Meanwhile Petroleum products saw substantial jump with holdings growing from Rs723cr in Jan 18 to Rs44,144cr in July 18.
 Auto and cement sectors witnessed marginal decrease in MF exposure (5.52%/2.64% in July vs. 5.62%/2.82% in Jan 18).
 Sectors which witnessed biggest decline in MF AUM between Jan-July18: Gas by -80%, Telecom services by -78%, Transportation by -73%, Media by -66%, Power by -20%, Construction projects by -11%, and Fertilisers by -84%.
- AUM (excluding derivative exposure) across all sectors witnessed 4.5% jump between Jan-July periods.
The Total AUM growth across all sectors (including derivatives) jumped by 6.6% between Jan-July period to Rs9.96lakh cr.
Direct equity retail participation at low levels…Rising share in MF equity schemes…
Direct retail participation in Indian equities saw continued offloading since 2009. Year 2017 and 2014 marked the highest outflows of Rs -18,734cr and Rs-23,878cr while Nifty climbed 29% and 31%, unperturbed by the retail outflows. Nifty’s substantial growth was on the account of rising participation by retail investors through professionally managed mutual funds via SIP (Systematic Investment Plans) and lump sum.
Retail participation in MFs drove DII’s share in liquidity…
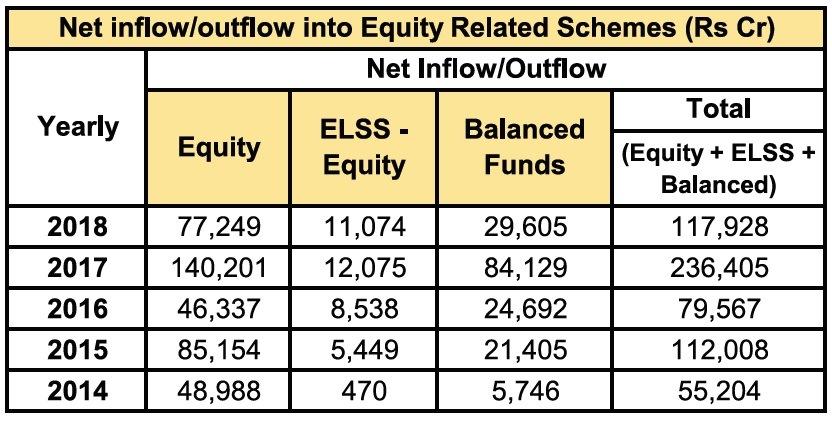
- Increased retail participation via equity related MF plans (Equity + ELSS equity+ Balanced funds) resulted in substantial increase from an average 5 year total inflow of Rs 1,20,222cr compared to inflow of Rs55,204cr registered in 2014.
- As per the latest AMFI data, total net flows in MF equity related plans decreased by 50% to Rs1,17,928cr in 2018 vs. Rs2,36,405cr in 2017. This was on account of higher jump in inflows in 2017 post demonetisation.
- Year 2017 had witnessed 197% jump in total inflows of MF’s equity related plans following shift of household savings from physical assets like gold and property to regulated market products, a process which was bolstered following demonetisation.
- Inflows into ELSS- equity rose to Rs11,074cr in 2018 vs. Rs470cr in 2014 and above 5 year average of Rs 7,521cr. Inflows in Equity schemes jumped by 58% to Rs77,249cr in 2018 vs. Rs48,988cr in 2014, below 5 year average inflow of Rs79,586cr. In Balanced funds, inflows rose substantially to Rs29,605cr in 2018 vs. Rs5,746cr in 2014. However, the inflows were marginally lower than 5 year average of Rs33,115cr.
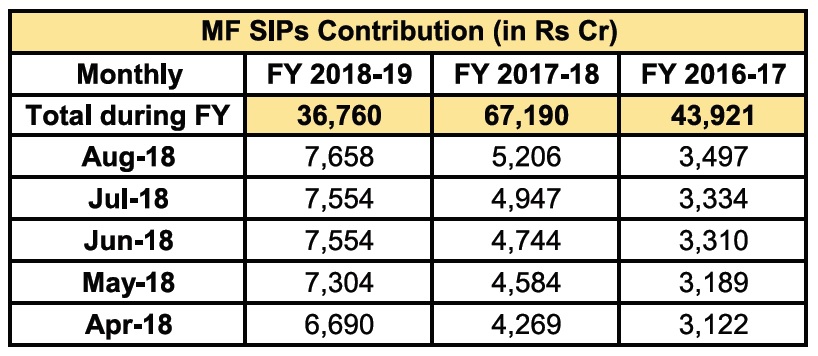
- Indian mutual funds have currently about 2.38cr SIP accounts through which retail investors regularly invest in Mutual fund schemes.
- AMFI data shows that the MF industry had added about 10.07 lakhs SIP accounts each month on an average during the FY18-19.
- Retail investment in MF through SIP (Systematic investment plans) rose 14.5% to Rs 7,658cr in Aug 2018 vs. Rs6,690cr in Apr 18.
- SIP Inflows grew 47% in Aug 18 vs. Rs 5,206cr in corresponding period of previous year.


