When trying to make a guess about a stock’s price, one is often faced with the onerous task of collecting a large chunk of data. For fundamental analysis, one requires data on profit, volumes, margins, assets, debt etc. over different periods of time, stacking them into models while also having to do with subjective analysis of economy, industry, competition etc. Technical analysis also uses historical data, but ignores all the fundamental data and instead focuses on the price volume data, and the statistical and pictorial inferences derived thereof. Derivative analysis is also similar with open interest data added into the mix, but option greeks derived from complicated formula separates this analysis from the rest. Obviously, today one is spared the task of data collection to a great deal, thanks to technology, but more often than not, technology also leaves a lot more than one can chew. So, if earlier the difficulty was on data collection, today, the difficulty is with narrowing down the choices of interpretation.
The decision can rarely be objective because, as long as man is at the other end of decision making, there is a bit of intuitiveness coming in, or a lot of it actually, at times. How far we can replace this subjectivity at the decision end depends on how far we can depend on the incoming data without having to second guess. It may not be desirable to fully avoid Intuitive decision making as it is helpful in arriving at a decision that breaks the pattern and allows us to see new and different outcomes, and hopefully with better results.
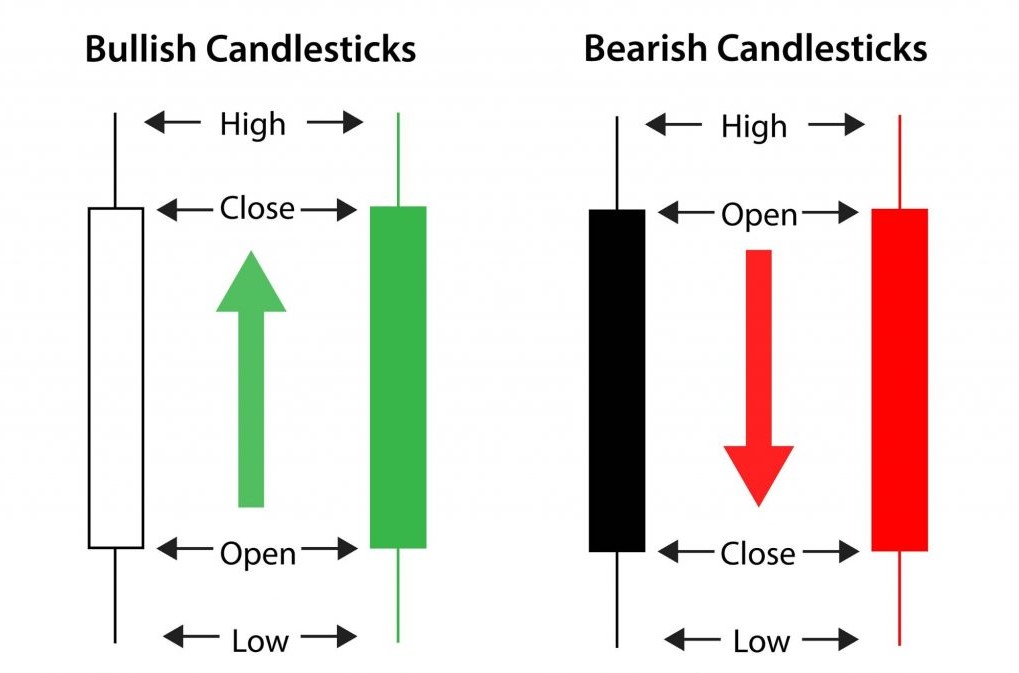
One way to tone down the intuitive element would be to allow incoming data to go through a model that does all the second guessing, allowing more objectiveness at the decision making end. And that is where candlestick analysis shines through, as it wonderfully articulates the tussle between bulls and bears, on an intraday basis, at reversal points, or during trend’s continuation. For example, the Japanese candle stick analysis attached great significance on the open and close prices, they being the two most action driven periods of the trading day. Candlestick analysis is a much discussed topic on the internet, so the effort here, instead, is to shed some light on the historical content of the early proponents of the candlestick analysis.

The Sakata rules
“The Fountain of Gold – The Three Monkey Record of Money”, which was written in 1755 stressed the significance of understanding traders’ emotions and the psychological aspect of market as critical components in successful trading. This book, arguably the first book on market psychology, was written by Munehisa Homma (1724-1803), considered as the father of candlestick analysis. He was a rice merchant who traded in the Dojima Rice Market in Osaka, Japan. He followed a set of rules which were called Sakata rules, because it was where Homma hailed from.
The five set of rules were: The Three Mountains, The Three Rivers, The Three Gaps, The Three Parallel Lines and the Three Methods
With these as guidelines, Homma is understood to have recorded on paper made out of rice plants, the price movements of the rice market. The open, high, low and close of each day was recorded and observed for patterns and repetitions to draw price signals. He even had his own communication system by placing men all the way from Sakata to Osaka, with flags to send signals.
According to research done by Steve Nison, who introduced Japanese candle stick analysis to the western world, the 100 year span between 1500 and 1600, referred to as Sengoku Jidai, meaning “Age of Country at War” had been instrumental in the evolution of candlestick analysis, its nomenclature etc. After this period of disorder, emerged three extraordinary generals – Nobunaga Oda, Hideyoshi Toyotomi and Leyasu Tokugawa over a 40 year period, which unified Japan, followed by a period of political and social development from 1615 to 1867, during the rule of Tokugawa’s family.
“The military conditions that suffused Japan for centuries became an integral part of candlestick terminology. And, if you think about it, trading requires many of the same skills needed to win a battle. Such skills include strategy, psychology, competition, strategic withdrawals, and yes, even luck.” – said Nison.
Just as the sight of an evening star hints that darkness is about to set in, an evening star candlestick pattern can be construed as a bearish reversal. Or, just as the sight of a morning star hints that sunrise is about to occur, a morning star candlestick pattern can be construed as a bullish reversal. And so on.
Some reports say that Homma was arguably the richest ever, had 100 consecutive winning trades, and that, he was so successful that he went on to advise the Japanese government, and was made an honorary Samurai. Whether he would have been as successful today, amidst a much wider pool of traders and with the availability to technology and trading setups not limited to handful, is certainly arguable. It is also inferred that he did not quite invent the candlestick analysis, but his trading principles as applied to rice futures evolved over time into the candlestick analysis.
But what is beyond doubt is that the trading principles and the body of knowledge developed by Homma over 250 years ago is as relevant today, as it was earlier.
Reference: Japanese Candlestick Charting Techniques by Steve Nison


