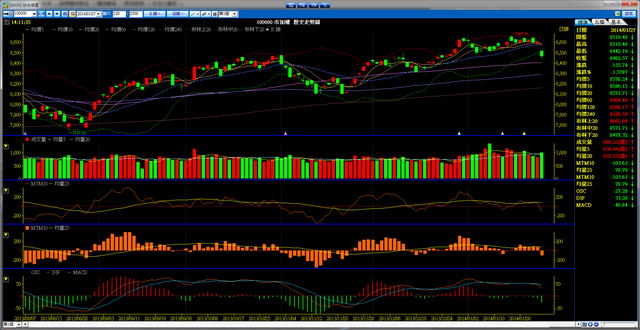
 Technical Analysis is the study of financial market activity using historical price and volume analysis. Technical analyst analyses price changes on a daily or weekly basis displayed graphically or numerically. The study is used for forecasting future price movements based on past data. Past data analysis can help investors anticipate the likely movement or the behavioral repetition of the stock over a period of time. Technical analysis is applicable to stocks, indices, commodities, futures or any tradable instrument. Apart from fundamental factors, there are many factors like trends, momentum and chart patterns that repeat over time even though not in the exact same way but forms the basis of technical analysis.
An outstanding feature of Technical Analysis is that it pre-empts fundamental data most of the time. As we all know, price of stocks move up in a new bull trend while the economy is not showing signs of recovery and stocks fall before the economic data show that the economy is in a recession. We all might know that emotions like fear and greed determine more of investors’ decision in stock selection and entry. Those following Technical Analysis tend to make fewer mistakes as far as emotional decision making is concerned. Learned investors who follow Technical Analysis often manage to act opposite to the mood of the masses and go against their own emotions while entering a stock and make them best positioned to earn money in the stock market. Technical Analysis uses many approaches including Chart pattern analysis, technical indicator analysis, price and volume data analysis, chart analysis etc. and the basis of all these is the OHLC data (Open High Low Close data). Furthermore, technical analysis helps an investor time his entry or assist in finding a better entry point and also in planning a short term exit point. Technical Analysis helps an investor in finding support and resistance levels using various, technical indicators and trendline which could be used to plan entry and exit points.
Apart from advantages, Technical Analysis too has disadvantages. Technical Analysis at times become subjective and personal interpretation is likely to overshadow the investment decision. Also, Technical Indicators may give late indications to buy or sell depending on the indicator chosen by the Analyst when the major part of the move already took place. Technical Analysis offers a wide range of indicators and at times investors get confused or annoyed when some indicators give false indications or they may not know how to combine various indicators to get a reliable result.
What is in it for investors? Technical Analysis can be used for intraday trading, short term investment and medium to long term investments. For intraday and swing traders, Technical Analysis provides support and resistance levels, reversal patterns etc. and for medium term investors’ analysis can be used to find possible entry and exit points using chart pattern analysis etc. One should keep in mind that even though there are some laid down universal principles that govern Technical Analysis, it is more of an art than a science and so is subject to interpretation. Being flexible in its approach, it would be best for each investor to find technical indicators that suits his or her style of investing.
Posted: November 2017


